


Bank Failures Spook Stocks | AVB Meets Signature Bank
The VIX is up more than 50% from Thursday’s low.

Follow @MrTopStep and @BretKenwell on Twitter and please share if you find our work valuable.
Our View
I like to say we live in an ever-changing world and that’s proving to be a fact over the last week. The collapse of Silicon Valley Bank, a bank most people in the US have never even heard of, continues to reverberate around Wall Street. Over the weekend, Signature Bank failed too.
Last night the ES immediately sold off from where it opened (at 3920.50) before a headline hit saying that the Federal Reserve will make available additional funding to eligible depository institutions to help assure banks have the ability to meet the needs of all their depositors and the ES rallied 60 points in 5 minutes and the YM rallied 460 points. Earlier in the day, Yellen said they were not going to bail anyone out.
I said on my Twitter livestream that we were entering a new credit crisis, I just didn't know it was happening now (give this a watch if you have the time).
The DAX hit a one-year high on Tuesday. Since then, it’s down about 800 points (and currently down about 450 points today).
Our Lean
If you are a long-time Opening Print reader, you know that I have said every rally has been a dead-cat bounce and that something bad was coming. Well guess what? This is just the beginning.
And you know what? I hate writing stuff like that. I truly do. I am a long-term bull at heart and I’d much rather be buying the dips while my friends’ and families’ 401K balances are going up each month, than sit here and type out the reality of our situation while selling the rips.
Back to reality.
SVB failed on Friday and then Signature Bank failed on Saturday. Silvergate said it would liquidate last week. Another failure.
How many more are there? Money is pouring out of the regional banks and that’s not likely to stop. Why would it?
Our Lean: There will always be pops during events like this. Covid, the credit crisis, etc. all had some pops, so we can’t rule those out. However, I don’t believe the rallies will last and more downside looks to be in play here. As the PitBull said back during the last crisis, the “wood appears rotten.”
And don’t forget, the CPI report is tomorrow and Friday is the quad witching. Levels below on charts, but the gist is: 3900, 3920-25 and 3950 are the upside levels. 3880 and 3820-3840 are the zones to watch on the downside.
I cannot emphasize this enough: Not all days are meant to be trading days. Do not trade simply to trade. It’s one thing to do so when it’s a slow day in August during a bull market with the VIX at $12. It’s another thing to do it now.
Trade small & trade smart or don’t trade at all!
MiM and Daily Recap
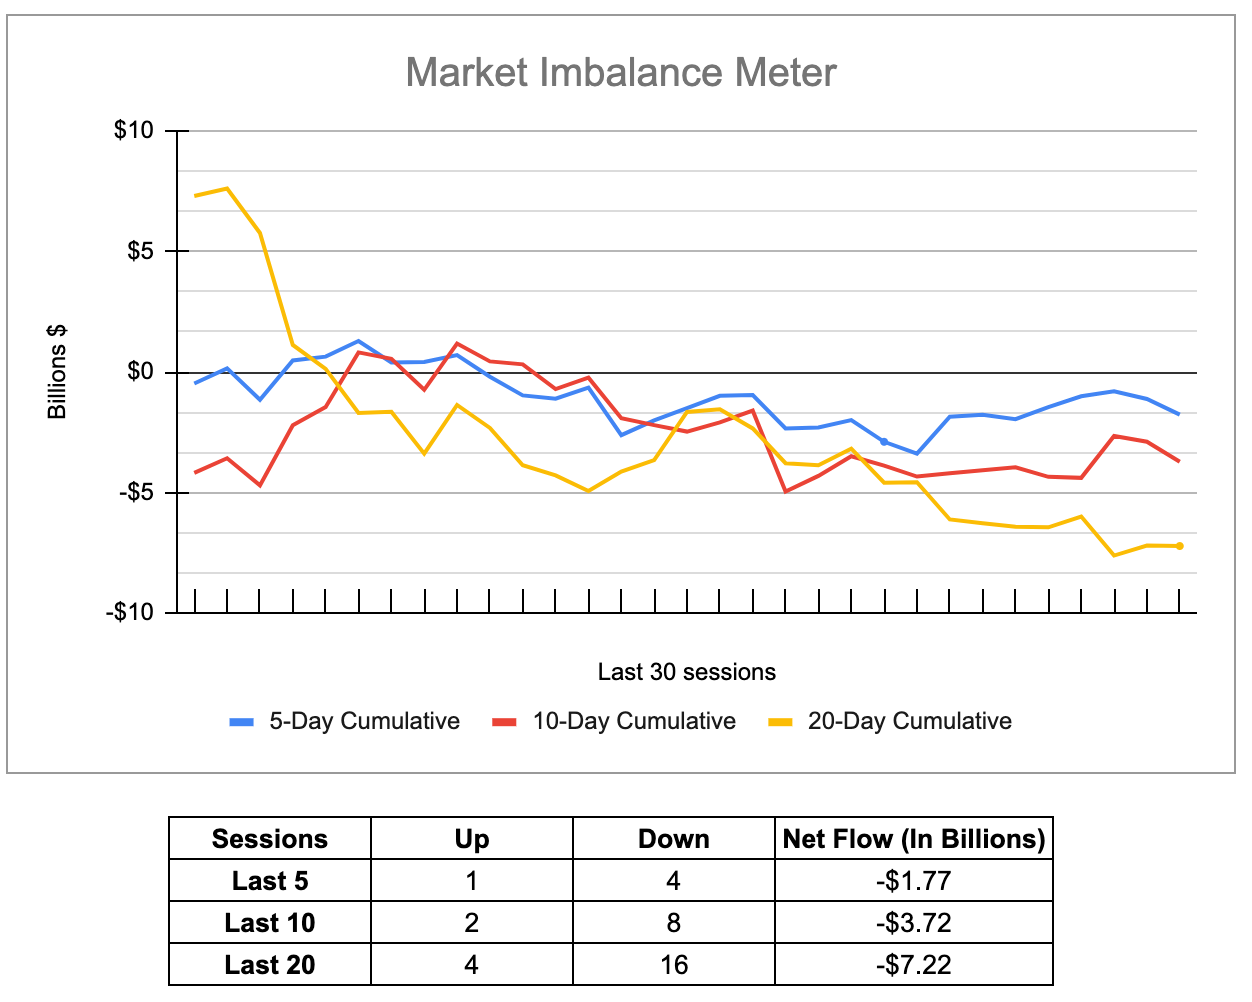
The ES traded down to 3884.25 on Globex, traded up to 3941.75 after the NFP report and opened Friday's regular session at 3913.50. The ES proceeded to trade straight down to the 3878.50 level in the first 15 minutes of trade, found its footing and proceeded to rally all the way up to 3934.75 at 11:35 on the European close. After the high, it was lights out and traded all the way down to new lows for the session at 3846.25 at 1:50. That’s right, it broke 90 handles.
After the low, the ES traded all the way back up to 3887 at 2:55. Then the ES traded back down to the lows at 3851.50 as the 3:50 imbalance showed $759 million to sell and traded 3862.75 on the 4:00 cash close. After 4:00, the ES rallied 16 handles and settled at 3879 on the 5:00 futures close, down 22.5 handles or down 0.6% on the day, while the S&P 500 index fell 1.56% on the session.
In the end, it was a horrible day for the indices. In terms of the ES's overall tone, it was extremely weak despite a few pops. In terms of the ES’s overall trade, volume was in-line with recent trading at 1.77 million contracts traded.
Technical Edge —
NYSE Breadth: 11.5% Upside Volume (!)
Almost back-to-back 90% downside days.
Advance/Decline: 13% Advance (!)
VIX: ~$29
This is not good. 3 banks have gone under in the last week, the S&P is breaking downside levels and the VIX is rocketing. From Thursday’s low to Friday’s high, the VIX rallied more than 50% (and now it’s trading above Friday’s high).
While equities haven’t felt that big of a punch yet — with the S&P down about 3.5% in two days — it’s concerning to see the flee from risk assets into safe-havens. Treasuries have exploded higher, as has gold. Traders are starting to price in rate cuts and pauses in rate hikes vs. just days ago pricing in higher rates for longer.
Some may say that rate talk is a positive — and it kind of is — but the reason for the pause is not good by any stretch of the imagination.
The worst part? The unknown. Investors aren’t sure how the bank situation is going to shake out with Signature and SVB. They also don’t know if there are more banks set to fail in the coming days or weeks.
Following in the footsteps of our past plans, we are going to slow down while the market is speeding up. That includes trading with less frequency and trading with smaller positions and focusing less on individual stocks and more on the indices.
S&P 500 — ES
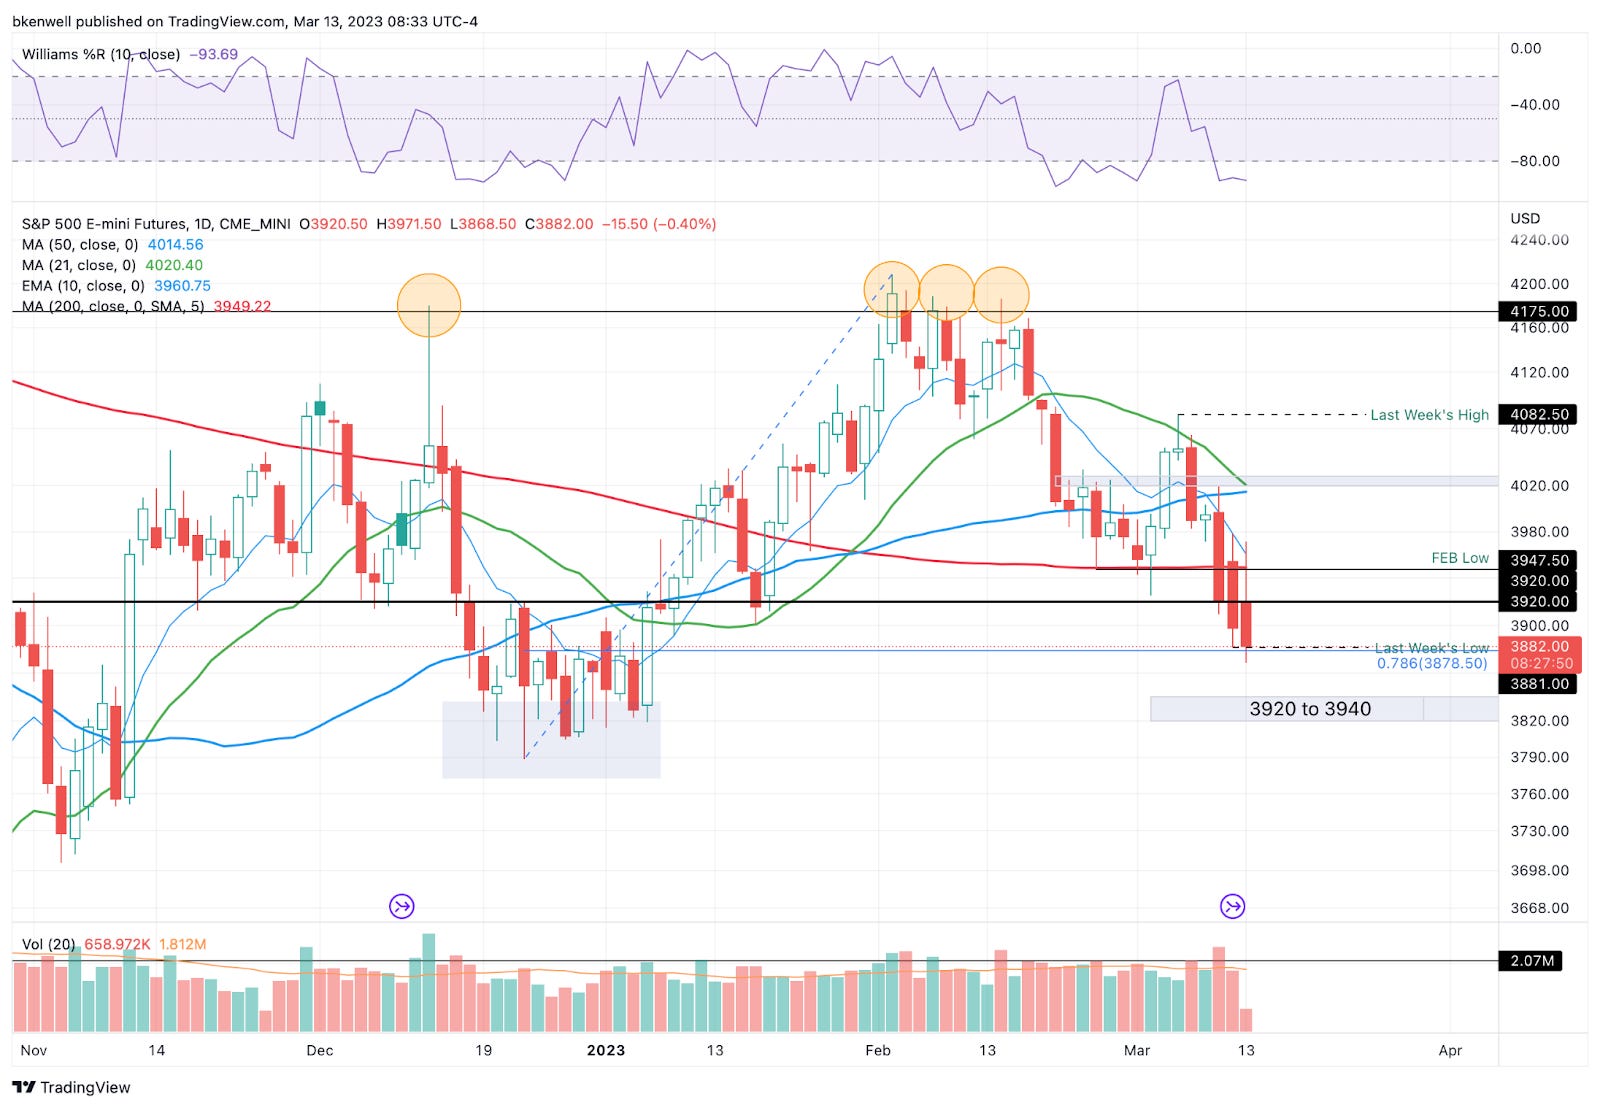
The ES couldn’t hold the 3910 to 3920 area, while our 3878.50 level held firm on Friday, with the low coming into play at 3881. Now, I’m not so sure that we can bank on that level twice.
The “failing firms” uncertainty creates a big headache in technical analysis, because the volatility ranges are greatly exacerbated.
If last week’s low can’t hold at 3881, it puts the 3820 to 3840 zone in play.
If we can regain and hold 3881, then 3900, 3920 and 3950 are my upside levels to watch (3900 being the “weakest resistance level” and 3950 being the strongest).
SPY
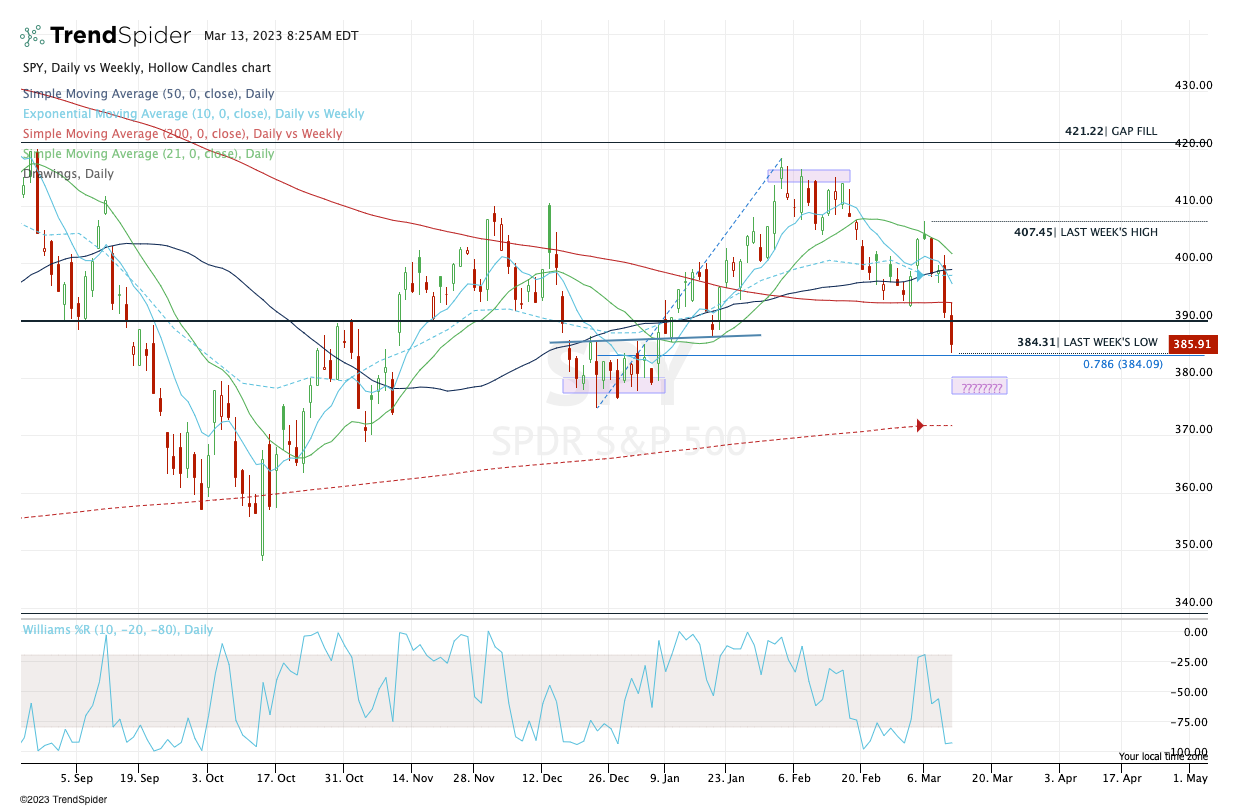
Like the ES, SPY found support on its 78.6% retracement on Friday near $384. This level will be a key line in the sand today. If it holds, $390 is in play on the upside, followed by $393 to $393.50.
I expect that latter zone could be resistance, given that it was support all last week.
On the downside, a true break of $384 could put the low-$380s to the high-$370s on the table. That zone was significant support in December.
Nasdaq — NQ
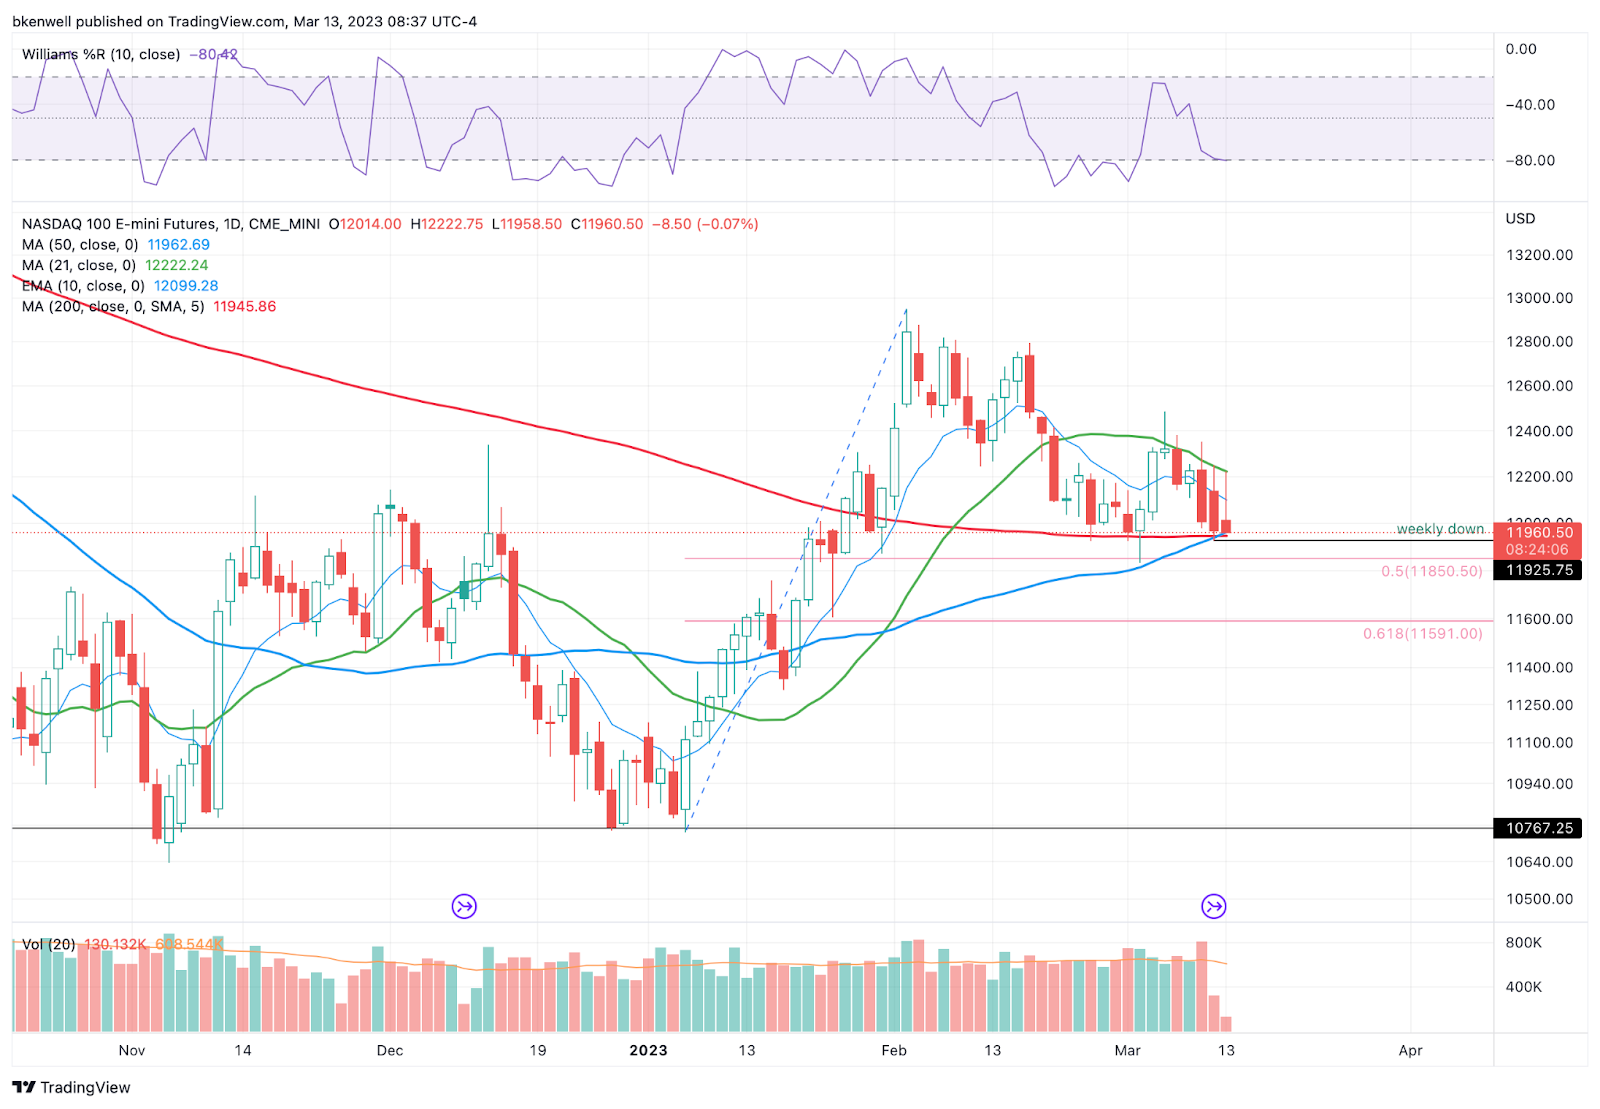
For its part, the NQ is actually holding up pretty well — but “is” is quickly turning into “was.”
Breaking 11,950 puts the NQ below last week’s low, as well as the 50-day and 200-day moving averages.
On the downside, watch 11,850. A true breakdown could send this down to 11,600.
On the upside, the level to hold and/or regain is 11,950. Over 12,000 could put 12,220 in play.
Open Positions
Bold are the trades with recent updates.
Italics show means the trade is closed.
Any positions that get down to ¼ or less (AKA runners) are removed from the list below and left up to you to manage. My only suggestion would be B/E or better stops.)
** = previous trade setup we are stalking.
MRK — Long from ~$110 and (disappointing action as it was oh-so-close to our first target, missing by a few dimes) — Ideal stop is clearly defined near $105. Initial target for ⅓ trim is $112.50.
Natural Gas, UNG or /NG — First target hit at UNG ~$10 and NG at 2.95 to 3.00.
Now /NG needs to hold the $2.40 to $2.50 mark in order for bulls to stick with this one. If it holds, I would love to see Friday’s highs hit again (the target of our prior trim).
AMD — Long on weekly-up over $81.63 — We got a third trim in AMD at $86 but not quite another trim at $88. That’s okay. B/E stop or full exit is fine.
Go-To Watchlist
*Feel free to build your own trades off these relative strength leaders*
Relative strength leaders →
NVDA, CRM
PANW, FTNT
SMCI, AVGO
WYNN, LVS → would love a reset to the 10-week ema
GE → would love a reset to the 10-week ema
FSLR
AQUA
TSLA
SBUX, ULTA, NKE
AEHR → volatile!
MELI
AXP → would love a reset to the 10-week ema
BA & Airlines — AAL, DAL, UAL
CAT
Economic Calendar
None. (CPI Tomorrow!!)