


Charting the S&P and Nasdaq

Thank you for bearing through today’s issue with two separate emails due to some technical issues.
We officially have a date and a link for the Mr. Top Step webinar on Saturday Sept. 10. The signup link can be found here.
Technical Edge —
NYSE Breadth: 85% Upside Volume (!)
NASDAQ Breadth: 74% Upside Volume
VIX: ~$27
Game Plan: S&P, Nasdaq
The VIX has gone from sub-$20 to $27 in just a couple of trading sessions, as the bear-market rally has quickly run into a brick wall.
Powell & Co. made it clear on Friday that the Fed will not rest until inflation is nailed into the coffin and buried six feet deep. It will not stop short and the Fed will not run the risk of stopping too early — even if that risks a recession. That’s as we have a tight labor market.
In Q4 2018, we saw a sharp V-bottom recovery as the Fed flipped from hawkish to dovish. In March 2020, the Fed (and global central banks) stepped in to provide an immense amount of liquidity amid the pandemic.
In both cases, these V-bottom market rallies were spurred by the Fed’s willingness to provide liquidity. That is not the case here; not yet anyway. As a result, we “cannot fight the Fed” and right now, the Fed remains hawkish.
S&P 500 — ES
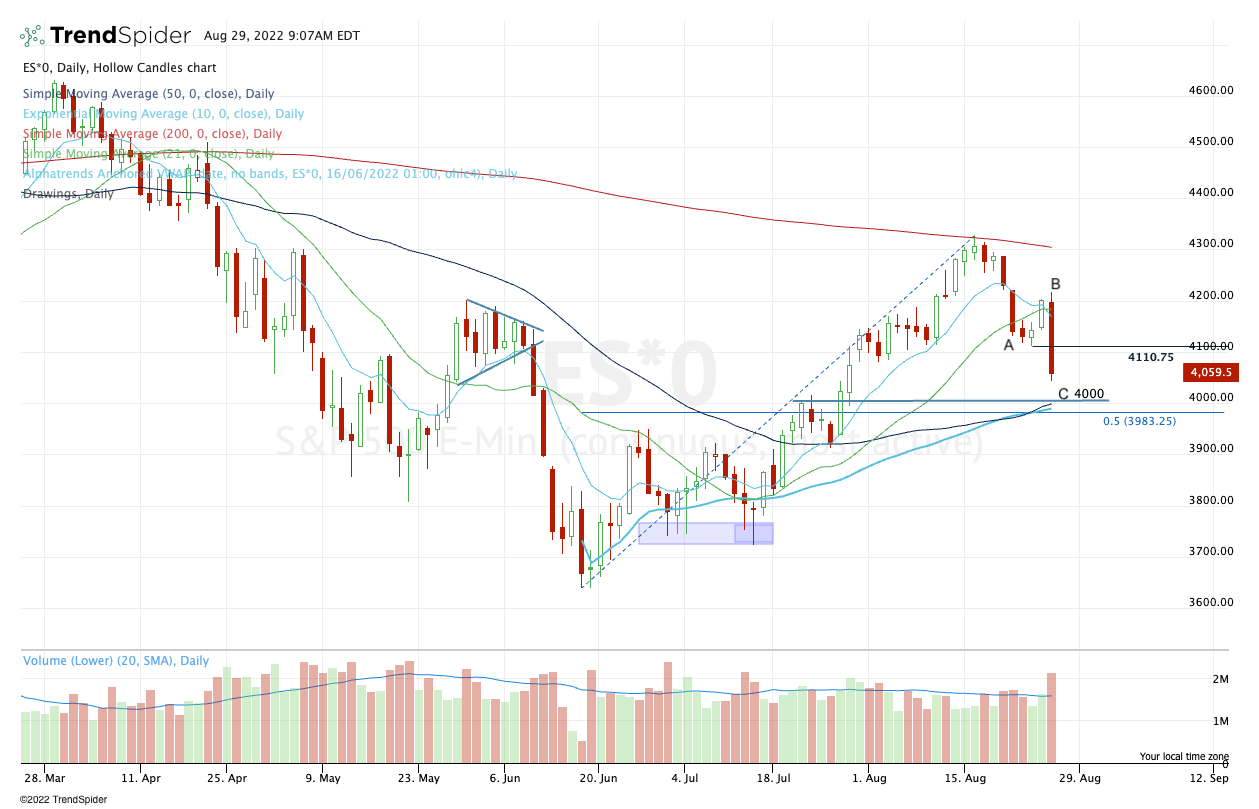
Last week, I wrote a “thought out loud” note, asking: “Could it really be so obvious to top at the 200-day and pull back to the 50% retrace and 50-day moving average, near 3980 to 4000?”
It appears that the “obvious” setup panned out, which is somewhat surprising. And I hate to make it sound easy, because it’s anything but…but on Friday we noted that a break of 4100 and failure to get back above it opened the door to 4000. Overnight, the ES printed ~4006. There now, this is make-or-break territory.