Our View
Short weeks are always tricky and today is the last trading day of May. According to the Stock Trader's Almanac, the day after Memorial Day has the Dow up 23 of the last 36 occasions (64%) and the first trading day of June has the Dow up 27 of the last 34 occasions (79%). June starts the summer stretch, which tends to be the weakest of all four seasons. Recent records have the S&P up 12, down 9 out of the last 21 years with an average loss of -0.50%, but a stronger showing for the NASDAQ with an average gain of 0.5% over the last 21 years.
For the week after “triple witching,” the Dow has been down in 27 of the last 32 years — so keep that in your back pocket.
The week ahead: Consumer confidence index is out today, PMI, ISM manufacturing and JOLTs data is due on Wednesday and the ADP report is due up Thursday. Friday has the monthly jobs number, where payrolls are forecast to rise by 428,000 as the unemployment rate holds at 3.6%.
With several big name companies reporting inflation-related profit pressures and seeing their stocks tank in recent weeks, people have become wary that firms could lay off workers and pause hiring to cut costs — and we’ve seen or heard as much from many companies, particularly in tech.
Our Lean
The last time the S&P 500 has snapped a losing streak of this length was in 1970, 1980, and 2001 — and twice the index rose more than 40% over the next 12 months.
The PitBull thinks the ES is at or near the high of this push up and is looking at the SPY August puts. For me? I don't know. It seems like the buyers spent a lot of money over the last three days and I’m wondering if they will try and keep the ES up into the end of the month and the beginning of June.
Nikolaos Panigirtzoglou of JP Morgan says more than $250 billion could flow into stocks by the end of June as American mutual funds and pension funds, and foreign pensions and sovereign-wealth funds “rebalance” by buying stocks and selling bonds to compensate for the latest drop in stocks.
My question is, how much money has already been rebalanced back into stocks? Is there more buying left or has the rebalance already been done?
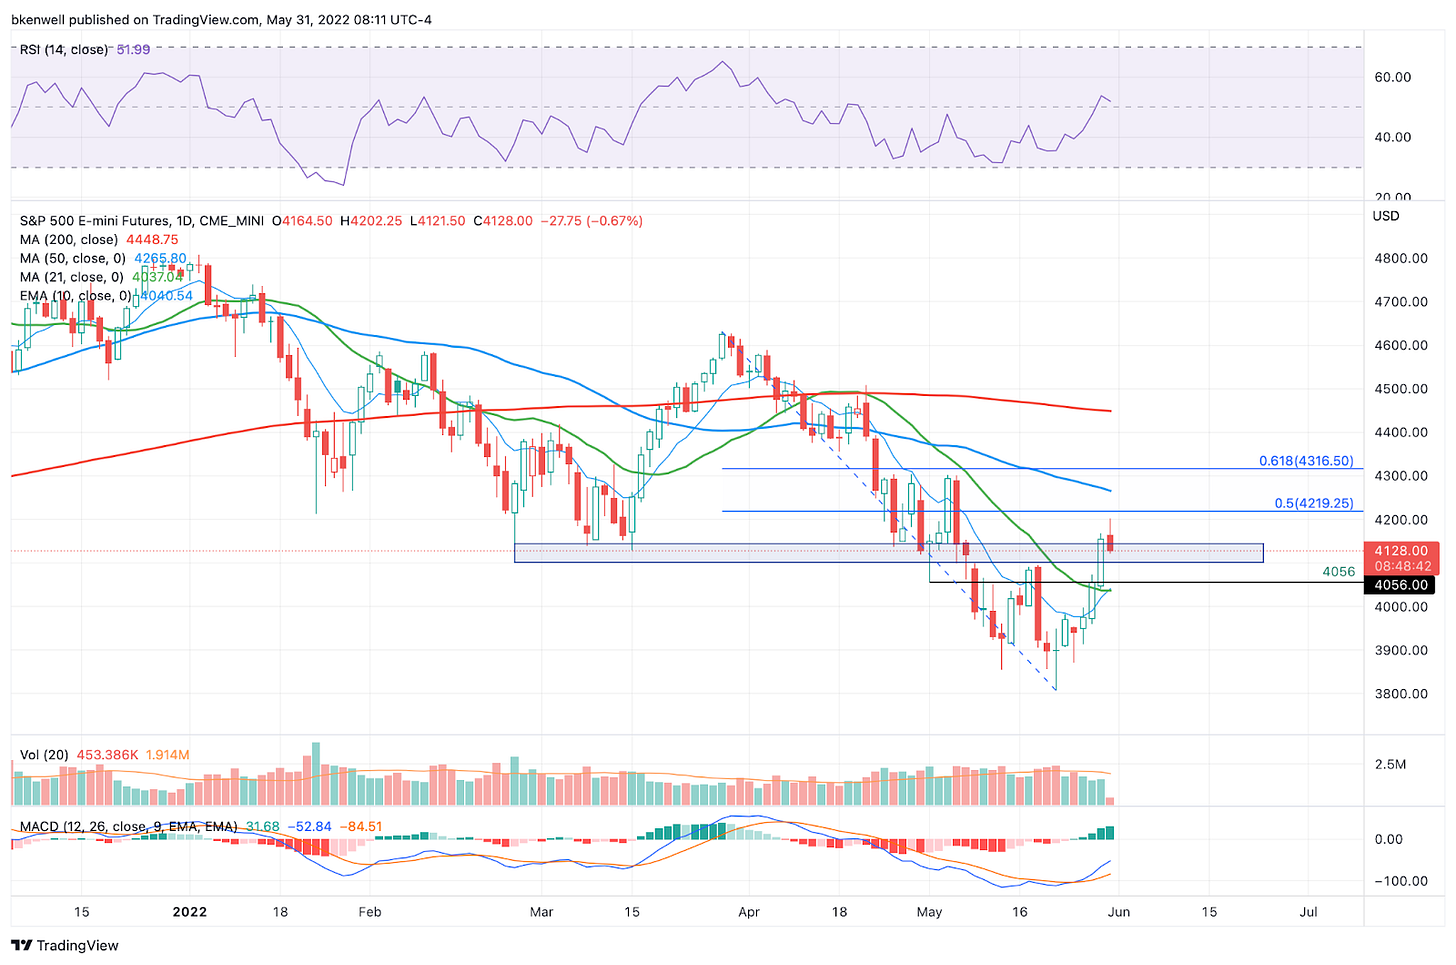
After the short Monday session, the ES is currently 65 points off Friday’s high. Our lean is to start slowly selling the rallies. If the ES holds up throughout the morning, I think there is a good chance of an end-of-the-month walk away. The 50% retracement is down at 4005.
Daily Recap
The ES opened Friday’s regular session at 4081.50 and shortly after the open, it rallied up to 4126 to 10:20, traded down to 4108 at 11:03 and never looked back. After the low, the ES got hit with a large buy program that pushed it up to 4132 at 12:16 before pulling back to 4121 at 1:52.
After the downtick, the ES rallied 28 points up to ~4149, back and filled, traded 4147.50 as the 3:50 cash imbalance showed $1.9 billion to buy and shot up to 4158 on the 4:00 cash close. It traded all the way up to 4168.25 and settled at 4168 at 5:00 — just a quarter-point off the high — up 100 points or 2.3% on the day.
During Sunday’s Globex session and the brief holiday session on Monday, the ES traded up to 4202.25, down to 4166.50 and settled at 4177.50 at 12:00.
In the end, the ES rallied from 3807.50 a week ago to 4202.25 the other night. The ES rallied 395 points or over 10%. In terms of the ES’s overall tone it was a buy programs and buy stops. In terms of the ES’s overall trade, volume was steady at 1.55 million contracts traded on Friday, which is solid considering the three-day weekend.
Daily Range: 127 points
H: 4168.25
L: 4041.25
Technical Edge —
NYSE Breadth: 87.1% Upside Volume (!)
NASDAQ Breadth: 80% Upside Volume (!)
VIX: ~$27.50
The VIX remains elevated in the high-$20s despite three robust days where the NYSE gave bulls 83%, 87% and 87% upside volume days.
In the past, we have had multiple stretches of back-to-back 80%+ upside days. But the last time we had three 80%+ upside days was in March 2020, on the 24th, 25th and 26th. You may recall that the S&P 500 bottomed on March 23rd.
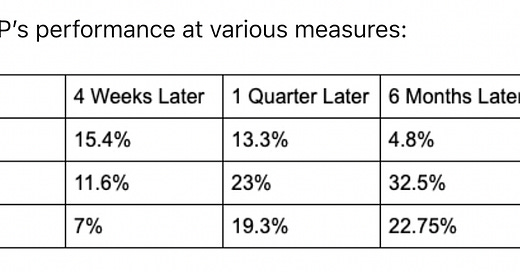
When we combine it with the stats of 7 or more consecutive down weeks (shown above), I think it’s a fair question to wonder whether the market has bottomed. I would feel comfortable thinking that the low is in for intermediate term, but of course, that doesn’t guarantee that it is!
Game Plan — S&P (ES and SPY), Nasdaq (NQ and QQQ), ARKK, Oil, Wheat
S&P 500 — ES
Man, I don’t know what else to say about the ES. It gave us the power move up to the the 4150 level. On Friday, we said if it goes weekly-up that this level was possible and the holiday trade likely made it work.
I want to take today slowly after such a strong finish to last week.
If the ES can clear Friday’s high at 4168, then 4200 is back in play. Above that opens the door to 4220, then the 50-day.
On the downside, holding 4100 is ideal, but 4050 and the 10-day and 21-day moving average is almost a necessity if bulls want to stay in control. All bets are off below 4,000.
SPY
One would expect the SPY to cool a bit after such a robust three-day run. If it does, that’s fine. But I want to see it hold $405, along with the 10-day and 21-day moving averages.
Below $400 and the bulls lose plenty of control.
On the upside, a push to the $420 area could be in play if the SPY clears Friday’s high. $421 is the 50% retrace of the 7-week down leg.
Nasdaq — NQ
We weren’t looking beyond 12,595 — the prior week’s high — on Friday, but +325 was enough points on the NQ to go into the weekend happy. That’s even as the NQ cleared 12,700 in Friday’s session and pushed even higher during Globex.
Now back into a significant area of interest, the NQ is feeling some pressure. That makes sense — it’s rallied 1000+ points in three days.
From here, I just want to see it hold the 10-day and 21-day moving averages.
Above 12,720 and the Globex high at ~12,880 is within reach. Above that puts 13K in play.
Nasdaq — QQQ
Tech has been more compressed than the rest of the market, so the QQQ could have more pep in its step if the rally continues.
On the downside, I’d love to see it hold $300 and its key short-term moving averages.
On the upside, $318 to $320 is the next big level. Above that puts $325 to $327 in play — which is the 50% retrace and the declining 50-day.
ARKK
ARKK ended last week by clearing the $44.50 resistance level and going weekly-up. If it holds the 10-day and 21-day moving averages, the stage is set for a push up to the $50 to $52 area.
If it loses the 10-day and 21-day, $40 could be back in play.
CTVA
Lower in the pre-market now with a low of $61.22 on Friday.
Can we undercut the low and tag the 10-day? If so, could give bulls a great entry.
CL — Oil
Clearing a key resistance area now, CL has the door opened up to $122.50. Rising oil prices could cap the stock market, as investors know the pressure that puts on the consumer.
Above $122.50 and $127 is in play.
We cleaned up on energy last week with XLE and XOM. These will be go-to candidates on the dip.
Wheat — ZW
I am keeping an eye on the 1114’4 area — last week’s low. If we break that mark and tag the 10-week ema, and the bounce back through 1114’4 (a classic reversal), then bulls can get long against this week’s low assuming it’s reasonable and look for a larger bounce.
If it doesn’t trigger, that’s okay. But it’s something to watch.
More aggressive bulls can just buy the dip to the 10-week.
Go-To Watchlist
*Feel free to build your own trades off these relative strength leaders*
Numbered are the ones I’m watching most closely. Bold are the trades with recent updates. Italics show means the trade is closed.
We have been spanking the very select individual trades we have taken. For that, I’m super grateful! It shows that discipline wins out in a tough tape.
DXY / UUP — 103.50 to 104 would be the ideal first trim area. For UUP, that's $27.50 to $28. For UUP, conservative bulls may be waiting for a gap-fill at $27.09 and a tag of the 50-day before getting long.
ZB (bonds) — Weekly-up in play → Came oh-so-close to our trim spot and reversed. Longs can either exit now for a small loss or hold as long as ZB can reclaim last week’s low of 140’01 and hold above it. I’m opting to exit at a small loss.
MRK — Got us our first target above $93. → Can go with a break-even stop-loss or use Friday’s low at $91.75. $94 to $94.50 is next ideal trim zone.
Relative strength leaders (List is cleaned up and shorter!) →
XLE / XOM
AR — just robust. Into the 161.8% nowz
DLTR
CTVA
VRTX
AMGN
MRK
MCK
JNJ
BMY


