What Are the Bonds Trying to Tell Us?
Friday's dip was the largest one-day decline since June 13
The stock market has enjoyed a powerful and strong bear market rally. The real question is, are the lows in?
We won’t know until we see how the market handles the downside. While the upside rally is nice and all, there are still a dozen upside hurdles and resistance points to take into consideration.
While those are of interest, how stocks handle the decline is more telling to me. Does it find support at prior resistance levels? How about the short-term moving averages? The recent price action certainly has the potential to lead to a new uptrend, but if support fails to develop, we could be looking at another move lower.
That has me looking at growth stocks, then bonds, as well.
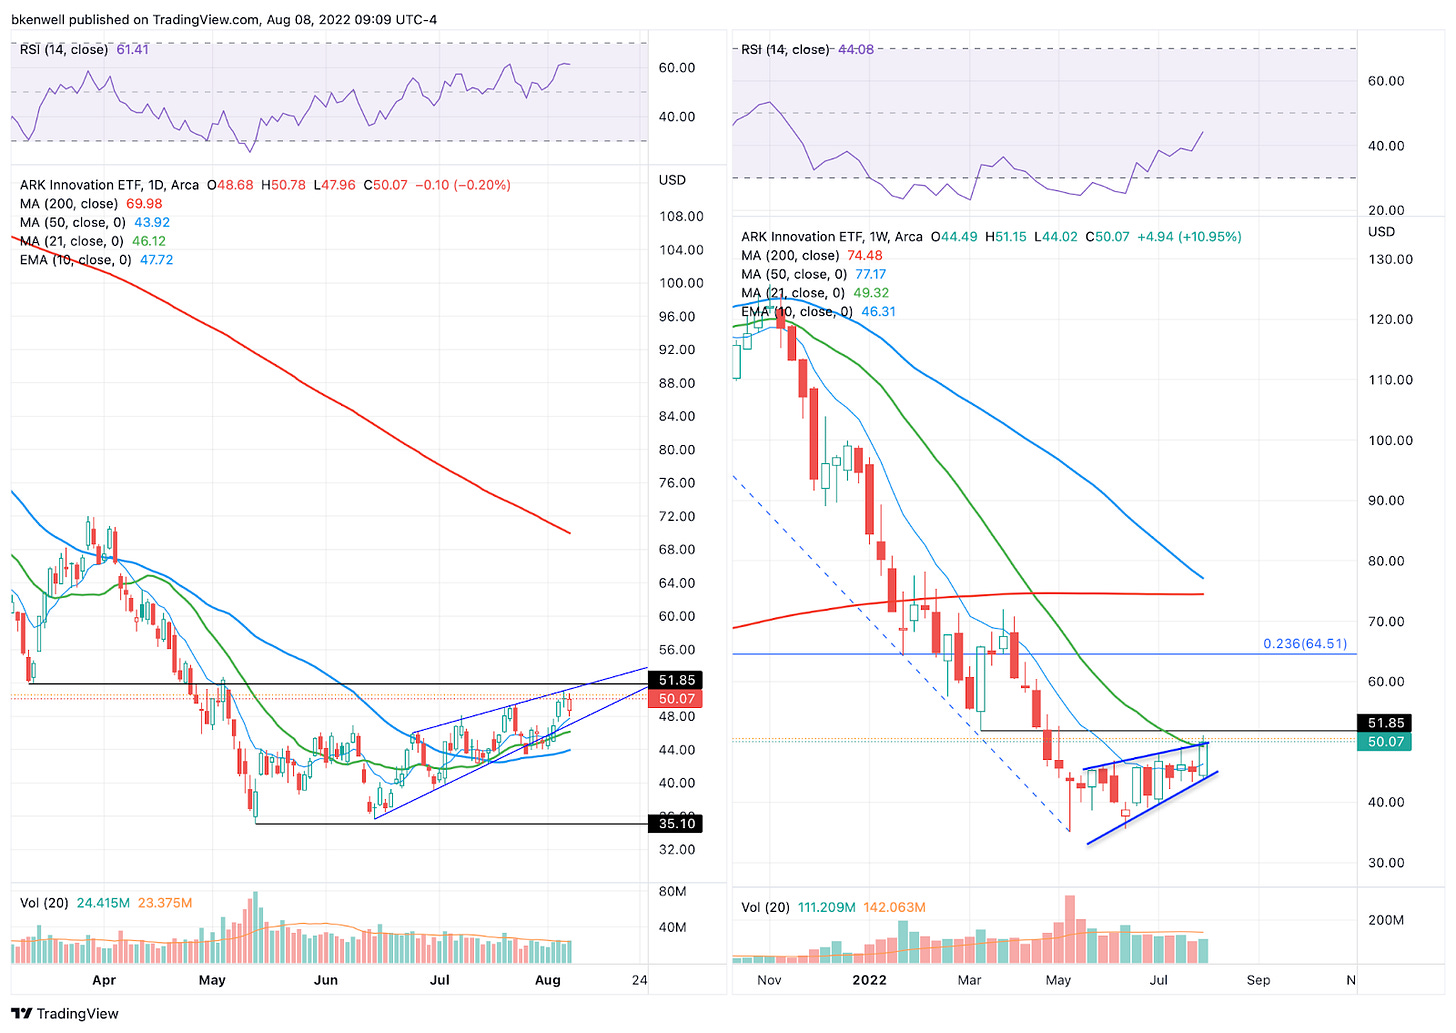
ARKK
No one likes ARKK and no one likes growth. That’s fine and I get it. But growth is a key “risk-on” asset and if the bulls are back to winning, growth stocks should tip their hand and show that that’s the case.
We’ve seen this rising wedge pattern playing out since the June lows, where ARKK failed to break to new lows like the S&P, Nasdaq, Dow and Russell, which was a big clue on the coming bounce.
It finished strong last week, although it faces a key test of the 21-week moving average and the ~$52 level. I want traders to keep in mind though, ARKK could rally to $65 — roughly a double off the lows — and still not even recoup 25% of the peak-to-trough decline!
However, I note ARKK because it highlights how well growth/tech have been trading…and its correlation with the TLT (bonds).
TLT (Bonds)
On Friday, the TLT ended with a 2.4% decline, its largest one-day decline since June 13. It bounced off the low and closed above its short- and intermediate-term moving averages. Friday’s closing price matched the prior week’s low as well: $116.47.
The rising wedge pattern is a bit more prominent in the TLT, while Friday’s action was a bit more…concerning.
Bonds tend to be a leader. They topped out in Nov. 2021, about 6 weeks before the Dow and S&P. They bottomed on June 16, a day before the S&P bottomed on June 17.
If the TLT can’t hold the $115.90 to $116.47 area (the last two week’s of lows), we could see a rotation to the downside. Could that be our clue to a move back to the downside in stocks? It certainly could.
Watch this area closely this week: $115.90 to $116.47, especially with the CPI report on Wednesday.
If bonds are done rallying, tech and stocks in general may not be far behind. It’s not a slam-dunk, but something to be aware of.
Good luck!


