Year-End ‘Buy Program’ Begins | Trading TSLA, AMD
Mutual Funds could be the next driver of the bull rally
A Quick Welcome
Hello everyone and thank you for being a part of The Opening Print. This is our official launch of the “new look” newsletter. We hope you enjoy it!
Danny’s View: The Opening Print
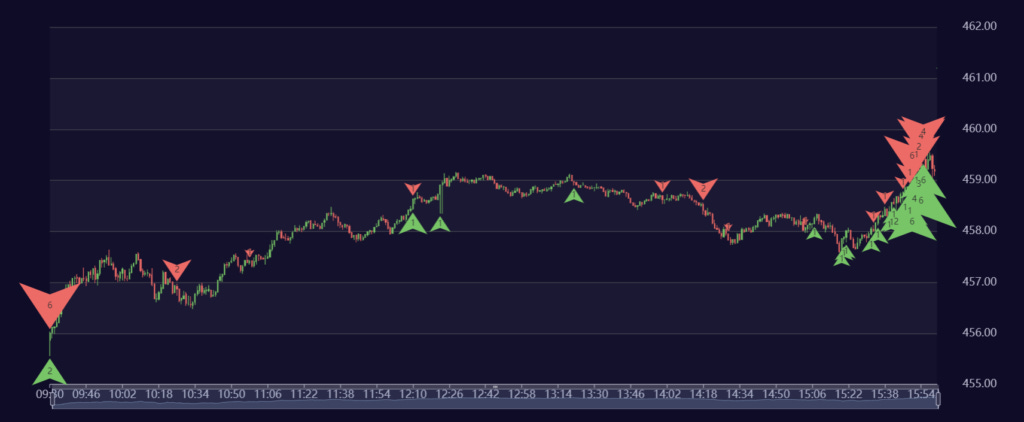
The ES sold off down to 4559.25 on Globex and opened Friday's regular session at 4563. Just before 10 a.m., it traded up to 4581.50, then dipped down to the 4575 area before making a lower high at 4581 at 10:33.
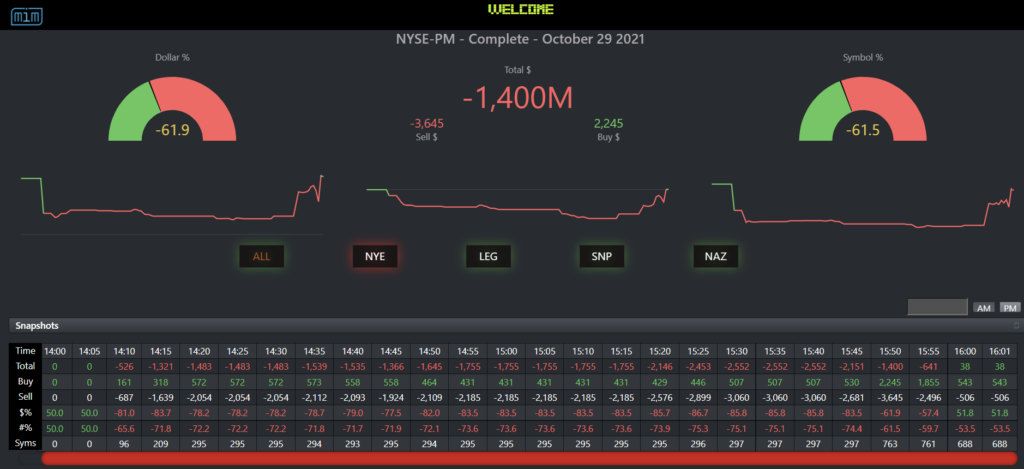
At 12:47, the ES printed another new all-time high at 4596.75, dropped down to 4591.75, made a lower high by 1 tick, then sold off down to 4581 as the MIM fell from $1.7 billion down to $2.5 billion for sale at 3:20 p.m.
After another small dip and rally, a buy program hit the ES, pushing it back up to the 4594.50 area at 3:47. The ES traded 4592.50 as the 3:50 cash imbalance showed $1.38 billion for sale and then ran up to 4601 at 4:00, made a new high at 4603.50 and settled at 4602.50 at 5:00 p.m., up 15 points or 0.33% on the day.
The Nasdaq futures (NQ) made a low at 15,595.50, but closed on the high at 15,864, up 99.5 points or up +0.63%. It ran hard into 4:00 and continued higher into the 5:00 close ahead of the weekend.
In the End
It looked like an EOM late day ‘walk away,’ but the futures reversed and made new highs above 4600. The S&P 500 rallied in the face of two major FAANG components selling off on earnings — Apple and Amazon — and capped off its strongest month since November 2020.
In terms of the ES’s overall tone, it was very firm. In terms of the day's overall trade, volume was higher with 263,000 contracts trading on Globex and 1.083 million contracts trading on the day session for a grand total volume of 1.346 million.
Our View
Nov. 1st is the first trading day of the best six months for stocks, historically speaking. I'm going to keep this short, sweet and simple.
The index markets are going to rally hard over the next two months and I think every dip will be a buying opportunity. At the end of last year when I called for ES 4,600, many people thought I was crazy. However, over a month ago I raised my year-end call to 4,750.
Now I'm looking at it and thinking how long does it take the ES to rally 150 points? I bet there are several instances where it happened over a two- or three-day run. I'm not saying that's going to happen necessarily, but if the ES is trading above 4,700 by the end of November, there’s a good possibility that we see 4,850 before we see 2022.
All I gotta say is “DON’T FIGHT THE FED.”
As discussed above, the S&P showed great resilience shrugging off the woes of Apple and Amazon. And this week the S&P is going to have to survive the Fed’s two-day meeting and Friday's October jobs report.
I am not here to change your mind if you think the markets are going down, I'm just here to do what I have always tried to provide: The flow and the feel of the markets.
Last week, I mentioned how you do not have to trade index futures to be a member of the MrTopStep chat. If you are looking for direction on the market, I think we stand out in that area. Over the years the chat and I have called hundreds of highs and lows.
So if you trade stocks or options and are looking for an edge, I would sincerely give MTS a try. We may learn something from you and you should learn a thing or two from us. If you don't, we give you 100% of your money back.
Our Lean
I am long the ES from 4569.50 and will add on the pullbacks. I think the ES goes higher, but a pullback and some back-and-fill would be exactly what the doctor ordered. You can sell the rallies and buy the pullbacks, but I'm keeping it simple and going with the latter.
Below are the stats for today and some choice posts I did in the chat on Friday. Like I said, I nailed it and that always feels great — especially going into the weekend.
November 1st Stats
DJIA: Up 13/21, Total Pts 946.33, Avg 0.21%
S&P: Up 13/21, Total Pts 87.89, Avg 0.17%
NASDAQ: Up 13/21, Total Pts 265.99, Avg 0.28%
R2K: Up 10/21, Total Pts 37.2, Avg 0.1%
Do a Time & Sales on any of the times below...
IMPRO: Dboy :(8:01:08 AM) : I added 1es at 4564.50 long 2 at 69.59
IMPRO: Dboy :(9:28:38 AM) : FRYDAY down open, people that sold and want to hold over the weekend put in buy stops
IMPRO: Dboy :(9:29:24 AM) : the ES will move to where the closest stops, the algos will chase the upside stops
IMPRO: Dboy :(9:30:53 AM) : rip has not started
IMPRO: Dboy :(9:31:35 AM) : buy imbalances
IMPRO: Dboy :(9:32:44 AM) : long day, some lower back and fill will feed it higher
IMPRO: Dboy :(9:33:00 AM) : last trading day of Oct, stats good for NQ
IMPRO: Dboy :(9:34:21 AM) : ES & NQ loaded with buy stops, algos can't help themselves
IMPRO: Dboy :(9:37:03 AM) : I think by the end of the day the ES will be 15 to 20 higher on the day
IMPRO: Dboy :(9:37:23 AM) : Fryday and gaps, do the opposite, always
IMPRO: Dboy :(9:38:51 AM) : I used to kill it on the floor on big gap Fridays
IMPRO: Dboy :(9:41:47 AM) : the overnight inventory 100% short, gap down, decent globex volume all points to people being short
IMPRO: Dboy :(9:42:20 AM) : the algos will always chase the largest area of buy stops
IMPRO: Dboy :(10:20:41 AM) : nice back to the vwap and hold
IMPRO: Dboy :(10:21:01 AM) : raids are coming but so is 4600
IMPRO: Dboy :(10:49:32 AM) : I really hope the ES trades 4600+ today
IMPRO: Dboy :(10:50:02 AM) : I say the odds are high
IMPRO: Dboy :(1:54:33 PM) : what did I say yesterday? nq 15,850 this week
IMPRO: Dboy :(2:53:11 PM) : this is very big end of the month buying
IMPRO: Dboy :(3:44:31 PM) : not saying they cant sell off again but if feels like there is a buyer for the 2 bil to sell
IMPRO: Dboy :(3:45:43 PM) : good shot at 4600 ++
IMPRO: Dboy :(3:52:20 PM) : nice MIM head fake
The rest of the story is history. I called for odds on Twitter that the ES would go to 4606 and it got up to 4603.50, up 25 points from where I called it. It is what it is folks. This is what I used to do on the floor and I still do it today. Not all the time, but I do do it and when I don't, many of the traders in the chat do. So there you go!
As we all know, there’s no crystal ball when it comes to trading stocks, options, or futures. But the Market Imbalance Meter may be as close as it comes. Knowing how the “Big Money” is placing its bets can give our trading room a big wave to ride — or a warning sign to stay out of the water. Come check it out now, risk-free for 30 days.
Technical Breakdown
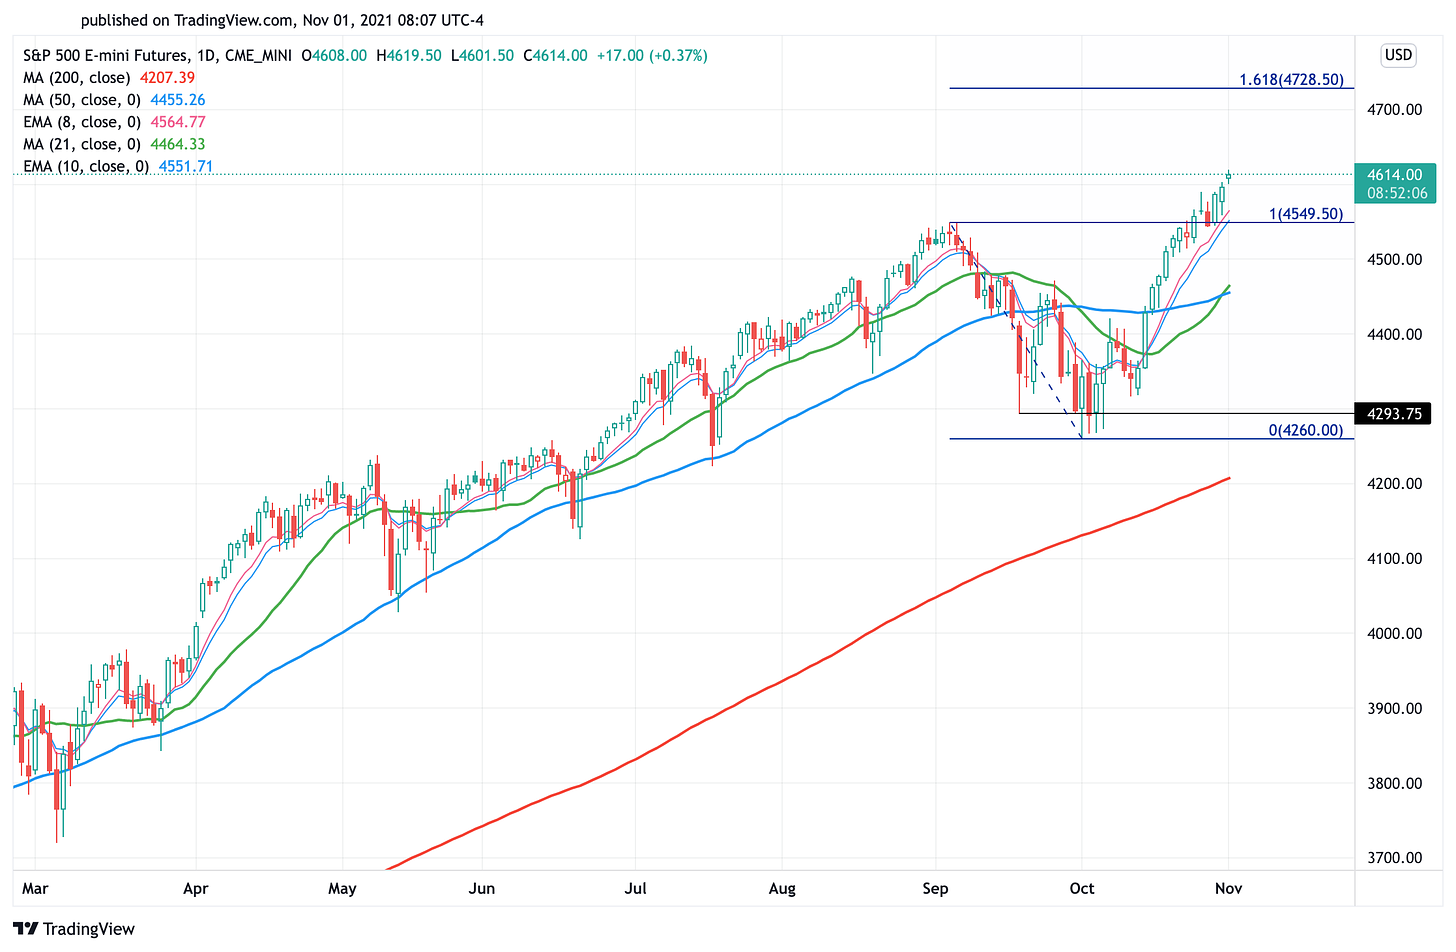
Just to add some color on the ES, here’s a look at the recent correction from September to early October. Notice how the ES found its footing near 4,293 — the September low.
After some chop and rejection from 4,400, the ES eventually reclaimed the 50-day moving average, which has been vital so far this year. Now over 4,600 and pushing new all-time highs ahead of the open, the S&P 500 is likely to give us our 60th record high this year.
Should the run continue, bulls should keep an eye on the 4,725 to 4,730 area. There we find the 161.8% extension of the most recent correction.
On the downside, don’t fret pullbacks to the 8-day and 10-day moving averages. A break of this area — assuming it doesn’t happen on Monday — puts the prior all-time high in play near 4,550. That seems like a buying opportunity as well.
How High Can Tesla Go?
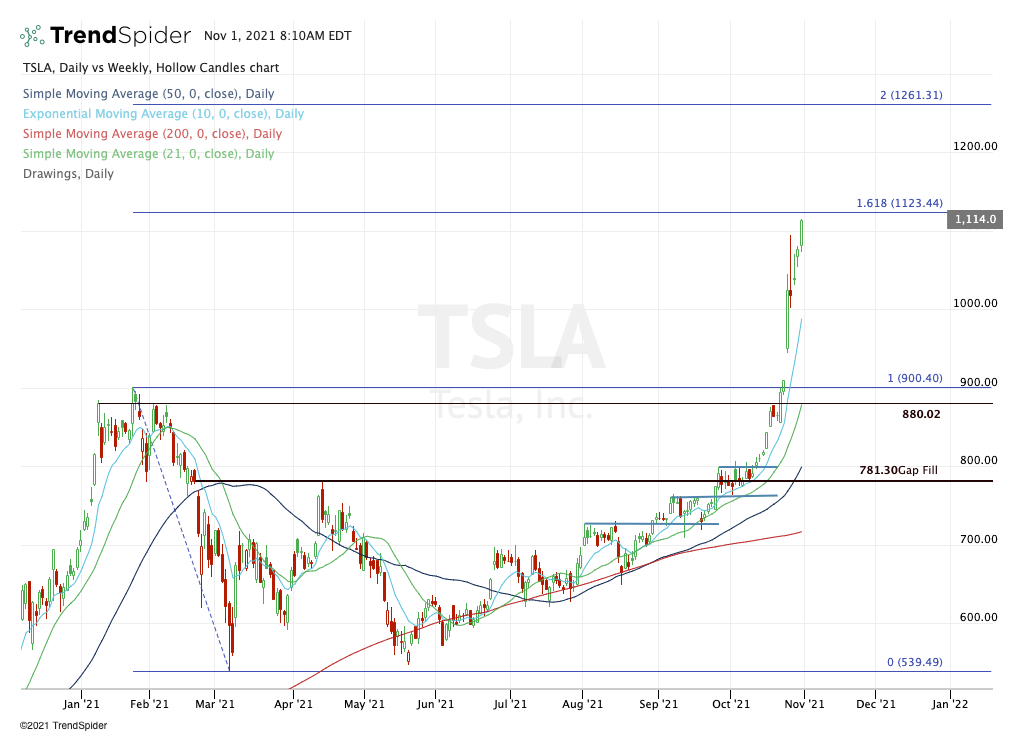
Tesla, Tesla, Tesla. This is literally the gift that keeps on giving. We have been fortunate to be pounding the table on this one, which has given bulls 10 straight weeks of gains.
Now working on its 11th weekly gain in as many weeks, longs need to be careful as Tesla is gapping higher by about 3% in pre-market trading on Monday. While great for those that came into the week long, it leaves TSLA vulnerable to a fade that could quickly turn into a reversal if it can’t hold the 161.8% extension at ~$1,123 or Friday’s high at ~$1,115.
While $1,000 was the obvious upside target for Tesla after it cleared new highs over $900.40, the $1,120 area was where we were looking…we just didn’t expect to so fast!
If the stock can clear $1,123 and hold it gains, $1,200 to $1,250 could be next. At some point though, this will need a breather.
AMD
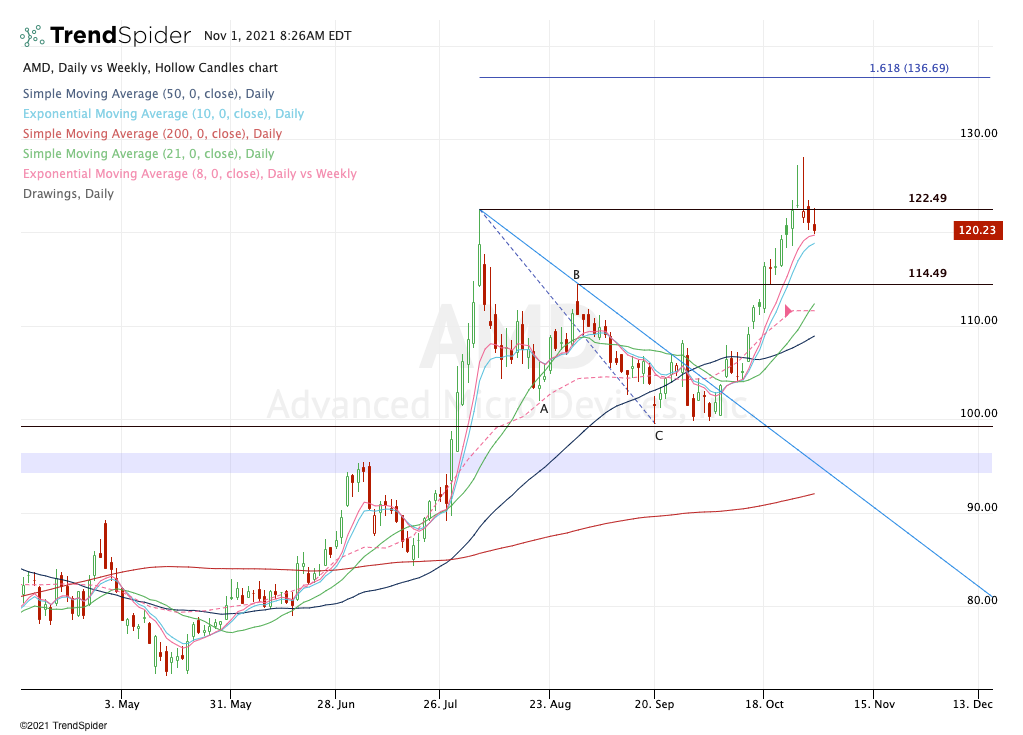
The company reported great earnings and a strong outlook, but there has been same fading in AMD in the days since its report. Now down into the 8-day and gapping lower in pre-market trading, I’m watching for one of two things:
A move lower down into the 10-day moving average. If it finds support, it’s a reasonable dip-buy trade from a risk/reward perspective.
A lower open that doesn’t test the 10-day, but instead, reclaims Friday’s low of $119.88.
No. 2 may be a little too nimble and we ultimately, we have to see how AMD opens. But we want to get a piece of it if possible.
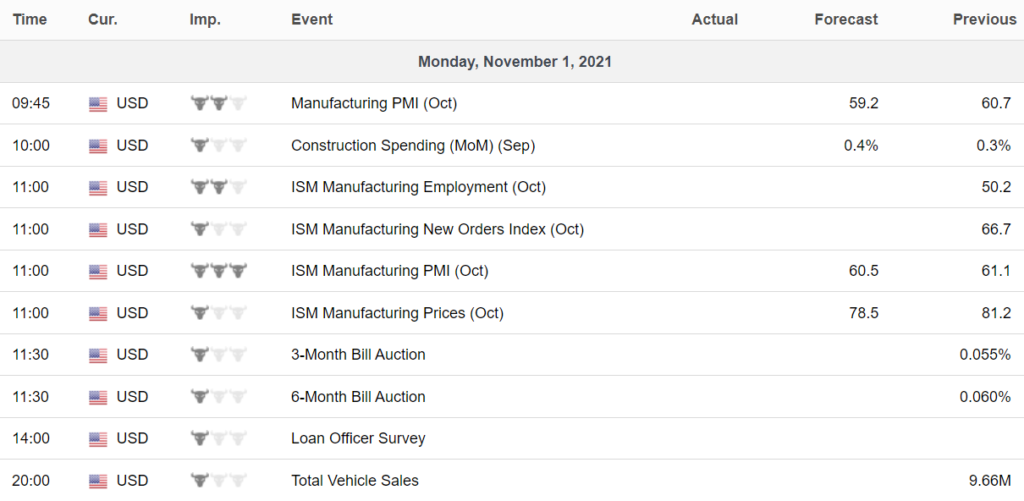
Economic Calendar
Chart of the Day
Facebook's name change spurs demand for META ETF
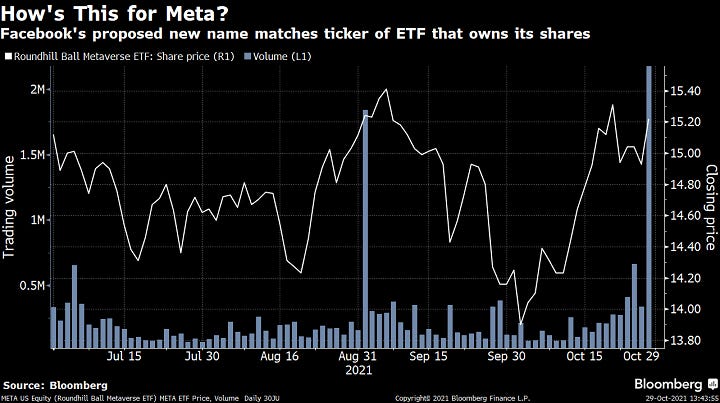
Facebook Inc.’s plan to become Meta left a mark on an exchange-traded fund that uses the proposed new name as its ticker symbol. It’s the Roundhill Ball Metaverse ETF, which debuted in June.
Facebook is the fund’s fourth-largest holding, trailing only Nvidia Corp., Microsoft Corp. and Roblox Corp., according to data compiled by Bloomberg. Thursday’s trading totaled 2.22 million shares, breaking a record of 1.84 million set in early September.
Market On Close: Last Day of the Month and a “sell” that did not matter.
>> Check out all the Market Closing action in our daily post <<
Questions? Please email me: Marlin@mrtopstep.com
Get the skinny when we get it: Join the MiM.
SpyGate: Lows on the open and highs on the close as buy programs dominate.
Check out our Daily SpyGate Post
SpyGate is now available free to members of IMPRO and MIM trading room. Join the MiM.
Disclosure: Trading Futures, Options on Futures, and retail off-exchange foreign currency transactions involves substantial risk of loss and is not suitable for all investors. You should carefully consider whether trading is suitable for you in light of your circumstances, knowledge, and financial resources. Decisions to purchase or sell as a result of the opinions expressed in the forum will be the full responsibility of the person(s) authorizing such transaction(s). BE ADVISED TO ALWAYS USE PROTECTIVE STOP LOSSES AND ALLOW FOR SLIPPAGE TO MANAGE YOUR TRADE(S) AS AN INVESTOR COULD LOSE ALL OR MORE THAN THEIR INITIAL INVESTMENT. PAST PERFORMANCE IS NOT INDICATIVE OF FUTURE RESULTS.


