S&P 500 Makes 75th New All-Time Highs in Past 12 Months
Where will the market find its footing now?
Over the past 12 months, the S&P 500 printed new all-time highs 75 times — the second-highest number since 1928, only surpassed by the mid-1990s.
Danny’s View: The Opening Print Recap
The ES traded down to 4680 on Globex and did what it does best (and exactly what we have been talking about).
It rallied up to 4699 at 9:28 am, opened Tuesday’s regular session a half point lower and traded up to 4700.50. From there, it backed off a bit, made two lower highs at 4700.25 and 4700.00 and then dropped down to 4687.75 at 9:50. It didn’t stop there. Seven minutes later the ES traded 4680.50.
Guys and gals, this is exactly what we have been talking about. A rally on Globex that gets sold at the open and bounces later in the day. That’s why in yesterday’s Opening Print I said traders could fade the open.
After a small uptick, the ES was hammered down to 4666.25 at 10:05. After the low, the ES back-and-filled and the futures traded up to 4684.75 at 10:45.
The ES then sold back off down to a higher low at 4667.75, rallied up to a lower high at 4680 and then puked all the way down to new lows 4663.26 at 12:06. After some chop, the ES traded 4671 going into 3:30 as the MIM ‘flipped’ to $67 million to sell. At 3:47 the ES traded 4675.50 as the 3:50 cash imbalance showed $184 million to buy.
At 4:00, the ES traded 4678.75 before settling at 4675.25 on the 5:00 futures close, down almost 17 points or 0.36% on the day.
In the End
The ES was hit by the dip in Tesla, as shares cratered 12%. We had a great bounce trade in Tesla on Monday, but the sellers showed up strong on Tuesday. Remember, Tesla is a trillion-dollar company. When it gets hit hard, there are consequences.
Reversals in Nvidia and AMD didn’t help matters, nor did the selling pressure in PayPal. We have been fortunate with some of our trades (like short NVDA and AMD), but when too many of these bigger names all start to move in sync with one another, the ES and NQ futures can fall apart.
In terms of the ES’s overall tone, it was weak but that is not a surprise. In terms of the day's overall trade, 1.258 million ES contracts traded on the day.
Our Lean
Like it or not, Tesla is a bellwether and when Elon Musk basically told you he was going to sell 10% of his holdings, the markets reacted in kind by selling off. The other part was there were various news items related to China’s real estate problems. When you put the two together with the ES being over-extended, yesterday’s dip ends up as the result.
All of that's great, but is the decline over? I do not believe it is. Can the ES rally? Sure, but the question is, will it hold?
As I said in the MrTopStep chat, “the current price action of the ES is the exact opposite of what it was a few days ago.” The new price action is selling the rallies, the exact opposite of back-and-fill. There are a few worthy traders I know that think the ES is going back to 4450 or even 4400. I don't see that, but if it does happen I will be looking to buy Jan calls and be long the futures.
Our Lean: As I have always said, no one knows for sure what the ES is going to do next and if someone tells you they “know,” they are full of shit. What we know is Monday's price action was lacking and Tuesday was a selloff.
To me it really doesn't matter what the cause was because our ‘feel’ was correct.
The news doesn’t matter. The headlines don’t matter. What matters? The reaction to the news and the headlines. How the market handles news is infinitely more important that what the actual news is.
We’re not changing our stance until the market changes its tune: Sell the early rallies and buy the pullbacks with a bias to the downside. Look at the charts.
As we all know, there’s no crystal ball when it comes to trading stocks, options, or futures. But the Market Imbalance Meter may be as close as it comes. Knowing how the “Big Money” is placing its bets can give our trading room a big wave to ride — or a warning sign to stay out of the water. Come check it out now, risk-free for 30 days.
Technical Breakdown — A Much Needed Refresh
I can’t tell you how incredibly fortunate we are with our trading lately. We have been able to ride a lot of these stocks higher to the upside, but have been cautious on the indices as of late. On Tuesday we were fortunate enough to nail reversal trades in AMD and Nvidia. The reversal trade in PayPal never triggered, as it flushed lower out of the gate.
I don’t like selling into big winners, but at times there are high-percentage odds in trades like that.
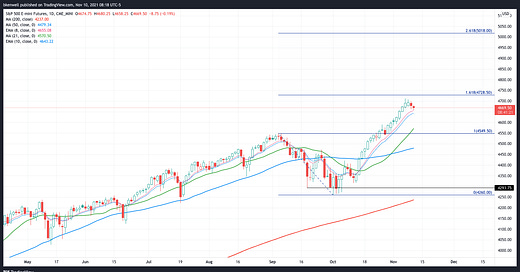
For now, let’s pump the brakes a little bit and not ruin a good run by forcing something. We have to let the trades come to us. As it pertains to the indices, look at the ES daily chart below.
The ES continues to be rejected from the 4700 area. That’s indicative by the wicks above this level and its failure to close above this mark. Now working on its second down day in a row, we’ll have to see who has more strength today: The bulls or the bears.
We have broken Tuesday’s low and at the Globex low, the ES was 1.14% off its all-time high. That’s not much but again, no one knows how much we’ll peel off the high. For now the ES has reclaimed Tuesday’s low at 4663.25 and is bouncing off the 8-day moving average.
A 1.5% correction off the highs will get us a test of the 10-day moving average.
A 2.5% to 3% correction will have the ES testing into last week’s low and the 21-day moving average.
A 3.5% dip gets us a retest of the prior breakout highs at ~4550.
In my opinion, somewhere in this 3% to 3.5% correction would be incredibly healthy for a year-end rally. It would shake out the weak hands and evaporate some of the frothiness we’ve incurred over the last few weeks.
Perhaps if the weakness in Tesla persists and if semi stocks (SMH) take a breather, we will get that much-needed pullback. That said, what I think is healthy doesn’t matter to the market.
Let’s also keep perspective. It took almost an entire year for the S&P to correct 5% on a closing basis. So what are the odds we actually get 3%-plus from the highs? I don’t know the answer to that and like Danny says, anyone that claims to know with 100% certainty is full of shit.
Over Tuesday’s low and we may be able to trade a bounce. However, I’d at least feel a bit better about a test down into the 4640 to 4650 area — and preferably the former, as it will get a test of the 10-day. From there, we can start testing some longs. If the market wants to roll over further, we won’t get in its way.
Disclaimer: Charts and analysis are for discussion and education purposes only. I am not a financial advisor, do not give financial advice and am not recommending the buying or selling of any security.
Remember: Not all setups will trigger. Not all setups will be profitable. Not all setups should be taken. These are simply the setups that I have put together for years on my own and what I watch as part of my own “game plan” coming into each day. Good luck!
Trading the Cycles
Topic: Taylor 3-Day Cycle
Author: David D Dube (a.k.a. PTGDavid)
Website: https://polaristradinggroup.com/
Tuesday’s Session was Cycle Day 3 (CD3): 3-Day Cycle Objective (4702) having been fulfilled and price failing to push above 4700 during Opening Range, setting up this session’s decline. Range was 37 handles on 1.255M contracts exchanged.
…Transition from Cycle Day 3 to Cycle Day 1
This leads us into Cycle Day 1 (CD1): Average Decline projection for CD1 measures 4655.50. Part of this decline is in-place during the previous session, so potential for further weakness spilling over into this session if prior low (4663) is violated and converted into lower resistance. As such, estimated scenarios to consider for today’s trading.
1.) Price sustains a bid above 4675, initially targets 4685 – 4690 zone.
2.) Price sustains an offer below 4675, initially targets 4660 – 4655 zone.
*****The 3 Day Cycle has a 91% probability of fulfilling Positive Cycle Statistics covering 12 years of recorded tracking history.
For more detailed information for both bullish and bearish projected targets, please visit: PTG 3 Day Cycle and/or reference the Cycle Spreadsheet below:
Link to access full Cycle Spreadsheet > > Cycle Day 1 (CD1)
Thanks for reading,
PTGDavid


